Discovery and quantification of plastic particle pollution in human blood
Link: https://www.sciencedirect.com/science/article/pii/S0160412022001258
Heather A. Lesliea Martin J. M.van Velzena Sicco H. Brandsmaa A. Dick Vethaakab Juan J. Garcia-Vallejoc Marja H. Lamoreea
https://doi.org/10.1016/j.envint.2022.107199
Environment International
Available online 24 March 2022, 107199
Abstract
Plastic particles are ubiquitous pollutants in the living environment and food chain but no study to date has reported on the internal exposure of plastic particles in human blood. This study’s goal was to develop a robust and sensitive sampling and analytical method with double shot pyrolysis - gas chromatography/mass spectrometry and apply it to measure plastic particles ≥700 nm in human whole blood from 22 healthy volunteers. Four high production volume polymers applied in plastic were identified and quantified for the first time in blood. Polyethylene terephthalate, polyethylene and polymers of styrene (a sum parameter of polystyrene, expanded polystyrene, acetonitrile butadiene styrene etc.) were the most widely encountered, followed by poly(methyl methacrylate). Polypropylene was analysed but values were under the limits of quantification. In this study of a small set of donors, the mean of the sum quantifiable concentration of plastic particles in blood was 1.6 µg/ml, showing a first measurement of the mass concentration of the polymeric component of plastic in human blood. This pioneering human biomonitoring study demonstrated that plastic particles are bioavailable for uptake into the human bloodstream. An understanding of the exposure of these substances in humans and the associated hazard of such exposure is needed to determine whether or not plastic particle exposure is a public health risk.
1. Introduction
Measuring toxic chemicals in human tissues is invaluable in confirming exposure levels and driving public health protection measures. A human health risk assessment (HRA) for plastic particle pollution is currently not possible due to lack of data on both toxicological hazard and human exposure (Leslie and Depledge, 2020, Vethaak and Legler, 2021). Measurement of plastic particle exposure is essential for HRA, yet validated methods sensitive enough to detect trace amounts of especially the small (<10 µm) size fractions of plastic particles in biological tissues have been lacking.
‘Microplastic’ is a term for plastic particles for which no universally established definition exists. In the literature, microplastic is often defined as plastic particles up to 5 mm in dimensions with no defined lower size limit (e.g. Arthur et al., 2009, GESAMP, 2015, ECHA, 2019). ‘Nanoplastic’ is a term for plastic particles in the submicron range, <1 μm. In the nanotechnology field, ‘nanoplastic’ may refer to engineered particles <100 nm, i.e. the nanotechnology application size limit. To circumvent the ambiguity of the terms microplastic and nanoplastic particles in this article we will refer to ‘plastic particles’ and where appropriate define the size or size range. Our study was concerned with plastic particles that can be absorbed across membranes in the human body. Our operationally defined method targeted particles that could be retained on a filter with pore size of 700 nm, i.e. particles ≥700 nm in dimension. The inner diameter of the needle used for venipuncture (0.514 mm) can be considered the upper size limit of particles this method could sample.
1.1. Plastic particle pollution
Analytical studies worldwide have established a large dataset of the occurrence of plastic particles in various matrices including e.g. biota (or gut contents) (Boerger et al., 2010, Karlsson et al., 2017, Ugwu et al., 2021), air (Gasperi et al., 2018, Wright et al., 2021), water (Koelmans et al., 2019, Danopoulos et al., 2020, Schymanski et al., 2021), sediment (Thompson et al., 2004, Phuong et al., 2021, Uddin et al., 2021) and foodstuffs (Van Cauwenberghe and Janssen, 2014, Barboza et al., 2018, De-la-Torre, 2020). The majority of available data is for particles with dimensions above 10 or 50 µm. Submicron sized plastic particles, such as those reported in seawater (Ter Halle et al., 2017), have been much less studied so far. As a whole, such data indicate the ubiquitous nature of plastic particles and raise the question how exposed humans are to such particles, and if exposure actually leads to uptake within the human body (Vethaak and Leslie, 2016).
Human feces were previously analysed with Fourier Transform Infrared spectroscopy (FTIR), providing evidence that micro-sized plastic particles can be excreted via the gastrointestinal tract (Schwabl et al., 2019, Zhang et al., 2021). Plastic particles were also detected in human colectomy specimens with FTIR (Ibrahim et al., 2020). Raman microspectroscopy has been recently applied to image and identify three polypropylene particles between 5 and 10 µm in human placental tissue (Ragusa et al., 2021).
1.2. The blood compartment
Blood as a compartment makes up 6–7% of body weight in humans. It irrigates the body’s organs and is the transport pathway for oxygen, nutrients and potentially also plastic particles around the body to other tissues and organs. The ultimate fate of plastic particles depends on whether they can be eliminated by e.g. renal filtration or biliary excretion, or deposited in either the liver, the spleen, or in other organs via fenestrated capillaries and sinusoids. A particle’s size, shape, surface chemistry and charge govern its interactions with biological systems, including the formation of a protein corona on the particle surface (Kihara et al., 2020). Blood’s role as transport pathway coupled with the feasibility of accessing samples directly from the body, without contact with plastic materials, makes it a suitable matrix for human biomonitoring of plastic particles and for the present study.
The degree of mixing within a bloodstream as a whole is considered to be high in healthy individuals, with environmental contaminants being distributed over different phases (aqueous, lipid, protein) throughout the circulatory system. Environmental microcontaminant levels measured in venous blood samples are assumed to be indicative for the entire bloodstream, including the microvascular system. Considering capillaries are typically only 5–8 µm in diameter, this forms a limit to particle sizes that can be expected in circulation in these microvessels, and any particles present would likely have an impact on microvascular fluid dynamics. In a well-mixed bloodstream, or in subsamples of a well-mixed blood sample, there are many open questions regarding how plastic particles of different sizes might be distributed. Some are likely to be localized in immune cells, while others may be adhered to proteins, lipid particles, other plastic particles or the vascular endothelium. While mass concentrations in a given sample may be detectable, the particles may be agglomerated, or the number of particles themselves may be present at dilute concentrations in the matrix. This gives rise to the possibility of observing non-detects and detects in duplicate samples especially for small sample intake volumes. However, there are both ethical and practical reasons for small blood sample volumes.
Because of the variety of interferences and non-plastic particles that could be present in a given blood sample, it is important to develop methods that can confirm both the polymer types and the concentrations present. In the advanced field of air pollution and human risk assessment (HRA), the concentrations of particulate matter ≤2.5 µm or ≤10 µm (PM2.5 and PM10, resp.) are sum parameters of particles that are collected through operationally defined sampling methods, quantified, and then mass concentrations per unit air volume are reported. One approach to quantifying plastic particles in the nascent field of plastic particle HRA is based on mass concentrations of polymers from plastic present as particles, analogous to PM10 for instance.
1.3. Analytical approaches
Many publications report abundance of particles identified as plastic with spectroscopy techniques such as attenuated total reflection-FTIR and µFTIR (Veerasingam et al., 2021), and Raman (Anger et al., 2018) or stimulated Raman (SRS) (Zada et al., 2018). Particle imaging provides information about particle sizes. A full characterization of particles in terms of particle size, shape, chemistries, surface charge, degree of weathering, protein corona in a given matrix are all legitimate parameters that can strengthen our understanding and the HRA process. However, for real-world biological matrices methods are currently still under development and measurement of all such parameters concomitantly is something for the future. Promising approaches include the use of the above-mentioned approaches but also e.g. time-of-flight secondary ion mass spectrometry (Jungnickel et al., 2016) and photoinduced forced microscopy (Ten Have et al., 2021), among others (Ivleva, 2021), to characterize the smallest particles, requiring sensitivity and selectivity of low and submicron particles that are expected in biological matrices. No one method fits all, therefore a combination of methods will be required to capture all possible information. Meanwhile, more and more laboratories are exploring thermal desorption mass spectrometry-based techniques to identify and quantify the mass of individual polymers in a sample (Fries et al., 2013, Duemichen et al., 2019, Ribeiro et al., 2020). Particle counting techniques and mass determination of polymers are useful, complementary approaches. While waiting for other methods to reach technical readiness, which is expected to take several years, we can already start building datasets for human exposure to plastic particles based on mass concentrations, analogous to air pollution particulate matter datasets based on particulate mass.
The present study focused on the analytical method development and measurement of human blood to identify and quantify the mass of five high production volume polymers applied in plastic materials: poly(methyl methacrylate) (PMMA), polypropylene (PP), materials containing polymerized styrene (PS), polyethylene (PE) and polyethylene terephthalate (PET). These polymers have applications in food contact materials, textiles and a wide range of other products humans come into daily contact with. PE and PP are the highest in demand worldwide, followed by PET and polymers containing styrene such as polystyrene, expanded polystyrene (EPS) and acrylonitrile butadiene styrene (ABS) (PlasticsEurope, 2020). PMMA has the lowest production volume in the test set, though it was selected because it is used in various applications inside the human body, such as in dental work (Frazer et al., 2005). For the present study, great emphasis was placed on method development and validation, running large numbers of blanks and other quality control measures in order to achieve sufficient method sensitivity and prevent false positives.
2. Methods
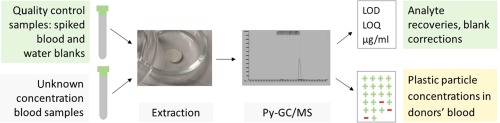
The analytical method developed, validated and applied here measures individual polymer mass concentrations in the sample (not particle counts) using double shot pyrolysis - gas chromatography/ mass spectrometry (Py-GC/MS). This semi-quantitative technique quantifies thermal degradation products of the plastic particles present in the samples (i.e. a destructive analysis).
2.1. Sample collection
Whole blood was obtained by venipuncture from 22 anonymized, healthy, non-fasting adult volunteers who signed an informed consent under the rules and legislation in place within the Netherlands and maintained by the VU Medical Center Medical Ethical Committee. Blood was collected in 10-ml glass heparinized vacutainer (BD Biosciences, Plymouth UK) tubes. The vacutainer was sealed by a rubber seal that is delivered with the glass vacutainers. The vacutainers remained sealed during the entire sampling procedure and storage period. Attenuated Total Reflectance-FTIR spectroscopy was used to identify the rubber seal material as isobutylene-isoprene rubber, a copolymer type that is not targeted in this analysis. Importantly, the vacutainer system is a closed device that allows blood withdrawal avoiding any contact with plastic tubing or reservoirs. Venipuncture was done by means of a surgical-grade sterile stainless-steel 21G needle (Becton Dickinson and Company, USA) that was connected to the glass vacutainer under vacuum, such that blood was drawn from the donor’s vein directly into the glass vacutainer. The entire sampling system (including needle and vials) was tested for background contamination (field sampling blank, n = 5) (see Quality control section). The blood samples were stored in vacutainers in the freezer at −20 °C until analysis.
2.2. Extraction method
The blood samples in this study were extracted and measured in duplicate (sample volume permitting, n = 18), in consecutive series, with multiple procedural blanks in each series to control for background contamination and correct measured concentration data in blood for the average procedural blank (see Quality control section). (Two aliquots were taken from each vacutainer for the duplicate analysis.) Throughout recovery experiments and the sample measurement series, a large number of procedural blanks were run.
After thawing, the blood samples in the vacutainers were mixed on a roller bank (CAT RM5, Zipperer, Germany) for 1 h. Per analysis, approximately 1 ml of whole blood was weighed and quantitatively transferred to a 20 ml glass scintillation vial (12383317, Yell, Germany) that was pre-rinsed with analytical grade MilliQ® water (Millipore, Burlington MA, USA). After adding 15 ml of TRIS-HCl buffer (400 mM Tris-HCL, pH 8, 0.5% SDS, Trizbase T6791, HCl H1758, Sigma, Schnelldorf, Germany) the vials were heated in a water bath at 60 °C for 1 h to denature proteins. To digest the proteins present in the whole blood, 100 µl of the Proteinase K (1 mg/ml, 3.0–15.0 unit/mg, T. album, P8044 Sigma, Schnelldorf, Germany) was added together with 1 ml of 5 mM CaCl2 (12095, Riedel-de Haën, Seelze, Germany) and the vials were incubated for 2 h at 50 °C. The CaCl2 prevents autolysis of Proteinase K and enhances thermal stability and substrate binding. Finally, the vials were shaken on a shaking table for 20 min. at room temperature and heated once more at 60 °C for 20 min.
The samples were then filtered over a mm GF/F glass fiber filter, diameter 25 mm, mesh size 700 nm (1825–025, Whatman, Maidstone, United Kingdom). To ensure removal of any plastic contamination present, filters were always heated in a 500 °C muffle oven purged with nitrogen prior to filtration. For filtration a special glass setup (crafted by the glass workshop of the University of Amsterdam, Amsterdam, the Netherlands), was adapted from a setup previously used (Karlsson et al., 2017) to concentrate all the filtered sample in the center of the filter within a surface diameter of 8 mm. The filter collected particles that could not pass through the 700 nm mesh of the filter. The sample residue on the filter was rinsed with 10 ml of a 30% H2O2 solution (Merck, Darmstadt, Germany) and rinsed with 15 ml MilliQ® water. The inner 8-mm circle of the filter containing the analyte residue was then sliced out of the center of the whole filter using a custom-made ring-shaped blade. The 8-mm filter was small enough to later fit into a pyrolysis cup (which has a volume of ca. 80 µl). Before transferring to a pyrolysis cup, the filter was placed in a pre-cleaned glass Petri dish (4 cm × 1.2 cm, 41042006, Karl Hecht, Sondheim, Germany) with a glass cover and dried in an oven (Binder, Emergo, Landsmeer, the Netherlands) at 45 °C for 4 h, to complete dryness.
In order to reduce the number of depolymerization products of PET in the analysis step, a reagent was used that results in the formation of a dominant product, dimethyl terephthalate (DMT) (reactive pyrolysis GC/MS, or RxPy-GC/MS). The dried filters for polymer analysis were treated with 10 µl of tetramethylammonium hydroxide reagent (25% in MeOH, 334901, Sigma, Schnelldorf, Germany). The filters were then dried again in the oven at 45 °C for 1.5 h. The dry filters were transferred whole to a pyrolysis cup for analysis with Py-GC/MS.
2.3. Analysis by Py-GC/MS
Analysis was performed using the multishot pyrolysis unit EGA/PY-3030D (Frontier Laboratories, Saikon, Japan) in “double shot” mode. First, the sample was placed in the pyrolyzer unit at 100 °C, which was then heated to 300 °C at a rate of 50 °C/min. After the sample was retracted, the GC/MS measurement started for any volatile compounds present on the filter, as they thermally desorb between 100 and 300 °C. The GC/MS (Agilent 6890 GC and 5975C MS, Santa Clara CA, USA) was equipped with a Ultra Alloy-5 column (30 m × 0.25 mm × 0.25 µm, Frontier Laboratories, Saikon, Japan). Measurements were done in SIM mode (Table S1) and in split mode (1:5 split ratio). The compounds were trapped on the GC column. The column was programmed from 40 °C (2 min) at a rate of 20 °C/min to 230 °C, and then 50 °C/min to 320 °C, resulting in a total run time of 13.3 min. After the thermal desorption step, the pyrolyzer was heated to 600 °C and the filter was again introduced (1 min) for the next measurement (pyrolysis). The column was programmed from 40 °C (2 min) at a rate of 20 °C/min to 320 °C (2 min), resulting in a total run time of 18 min.
The compounds that are desorbed in the first run (‘shot’) are molecules that are volatilized between 100 and 300 °C and can include unpolymerized monomers, additives and other sorbed chemicals. Polymerized target analytes such as polystyrene, EPS, ABS, PP, PE, PMMA are physically unable to volatilize in the ‘first shot’ because the maximum temperature of 300 °C is too low (therefore they are retained for the second shot). Any monomers (e.g. styrene) potentially present in the ‘first shot’ run were not used in determining concentrations of plastic particles, except for PET where the derivatization product already forms at 300 °C and the results from both the first and second shots were combined. The pyrolysis second ‘shot’ chromatograms were used for determination of the other polymer concentrations associated with particles. These were not affected by interferences from monomers in the first shot. Note that the analysis of additives was outside the scope of this study. Note also that studies of chemical additives in plastic in whole blood do not confirm the concomitant presence of plastic particles in the sample, as additives can desorb (or leach) from plastic materials throughout the lifetime into other hydrophobic phases such as organic matter and the food chain prior to uptake in the bloodstream, or in some cases come from non-plastic sources.
Target polymers included PMMA, PP, PS, PE and PET. The pyrolysis products measured in double-shot Py-GC/MS were methyl methacrylate (for PMMA), 2,4-dimethyl-1-heptene (PP), styrene (PS), 1-decene (PE) and as mentioned above, dimethyl terephthalate (PET). Because styrene can be a pyrolysis product of not only polystyrene, but also of EPS and copolymers of styrene (e.g. acrylonitrile butadiene styrene, styrene/butadiene co-polymer), we quantified styrene as a pyrolysis product of any polymerized styrene from different styrene-based plastics (abbreviated here as PS).
Quantification of pyrolysis products was performed using a calibration curve containing all target polymer types at known concentrations. The polymer standards used were: poly(methyl methacrylate) (PMPMS-1.2, Cospheric, Santa Barbara, California, USA), polypropylene (Sigma-Aldrich, Schnelldorf, Germany), polystyrene to represent materials containing polymerized styrene (PSMS-1.07 Cospheric, Santa Barbara, California, USA), polyethylene (CPMS-0.96 Cospheric, Santa Barbara, California, USA) and polyethylene terephthalate (Goodfellow Cambridge Ltd., United Kingdom).
The five target polymer standards were weighed (3 mg each) and transferred to a 22-ml stainless steel accelerated solvent extraction (ASE) cell containing 23 g of sea sand (which had been preheated at 600 °C in a muffle oven purged with nitrogen for 1 h to remove plastic residues) for dispersing and assisting in the ASE process. The polymers were dissolved in dichloromethane (DCM) (Biosolve, 0013796002BS, for Dioxins, Pesti-S, Furans, PCBs analysis, Valkenswaard, the Netherlands) in an ASE (Thermo ScientificTM ASETM 350 Accelerator Solvent Extractor 083146, Waltham, MA, USA) at 180 °C, at a pressure of 1500 psi, with further ASE conditions as follows: static time 5 min, 3 cycles, rinse volume 80%, purge time 1.25 min, and heating time 9 min. From the resulting solution, five different volumes were added to pyrolyzer cups and measured to obtain a calibration curve (linear fit) for the 5 polymer standards present. The concentrations in the calibration curve for the 5 different standards were between 15 and 400 ng polymer absolute each.
2.4. Quality control
Measures taken to ensure data quality were performing a spiking experiment, reduction and control of background contamination during sampling, extraction and analysis through the inclusion of a large number of blanks (sampling blanks, procedural blanks for the spiking experiment and donor blood analyses), reporting limit calculations and performing duplicate analyses.
2.4.1. Recovery experiment
To determine the recoveries of the polymers in blood with this method, a spiking experiment was performed. A mixture of the five polymer standards was spiked into blood subsamples (of a large sample of a single donor) at low analyte concentrations, in eight-fold. This was repeated for a mixture of the five polymer standards but at higher concentrations, also in eight-fold. Eight unspiked blood samples were added to the series. All 24 blood samples in the recovery experiment were measured following the procedure for extraction and Py-GC/MS analysis as described above.
At the same time, eight procedural blank analyses using analytical grade MilliQ® water were measured. With these blanks, we were able to correct for background polymer concentrations potentially introduced during sample preparation and analysis of the unspiked blood, in order to determine which polymers were already present in the blood used for the recovery experiment.
For the lower concentration spike experiment, 10 µl of the multiple standard solution was added to each of the blood subsamples (n = 8). For the higher concentration spike experiment, 75 µl of the standard solution was added to each of the blood samples (n = 8). After measurement, the spiked blood samples were corrected using the data for the unspiked blood samples (note: without correction for the MilliQ® procedural blank), and the recoveries were calculated for the 5 individual polymers. Recovery (%) was calculated by dividing the measured polymer concentration (corrected for the blank) by the nominal spiked concentration × 100%.
2.4.2. Controlling for background contamination during sampling
Sampling blank analyses (n = 5) were performed on the glass BD vacutainers used for sample collecting by rinsing the vacutainers thoroughly with MilliQ®, collecting the residue in the filtration setup used for samples followed by analysis with the same Py-GC/MS method. If a blank signal is found, this step makes it possible to make corrections for background contamination inside the vacutainer or needle.
2.4.3. Controlling for background contamination during sample preparation and analysis
Procedural blanks (n = 31) were performed using analytical grade MilliQ® water during measurement of the donor blood samples. Procedural blanks underwent sample pretreatment and analytical steps identical to whole blood samples. The procedural blank measurements were plotted in Shewart charts for each polymer type. The analyte concentrations reported for the blood samples were corrected for the corresponding average blank value from the Shewart chart.
2.4.4. Limits of detection and quantification
The limit of detection (LOD) was calculated as 3 × the standard deviation of the average long-term value for each analyte’s procedural blank signal. The
2.4.5. Duplicate measurements of donor blood
Observing the level of agreement between duplicate measurements can indicate the degree of analytical precision, sensitivity, but also the potential heterogeneity of the analytes’ distribution throughout the blood sample. Each blood sample was measured in duplicate in consecutive series with the exception of donors 6, 9, 15, and 18.
3. Results and discussion
The sensitivity and performance of the method was demonstrated via the recovery experiment and the control of background contamination throughout sampling and analytical procedures, as described in Section 3.1. The attention to quality control was key to ensuring the accuracy of the measured concentrations in blood (Section 3.2) was sufficient to support the conclusions of this study.
3.1. Quality control
3.1.1. Recovery experiment
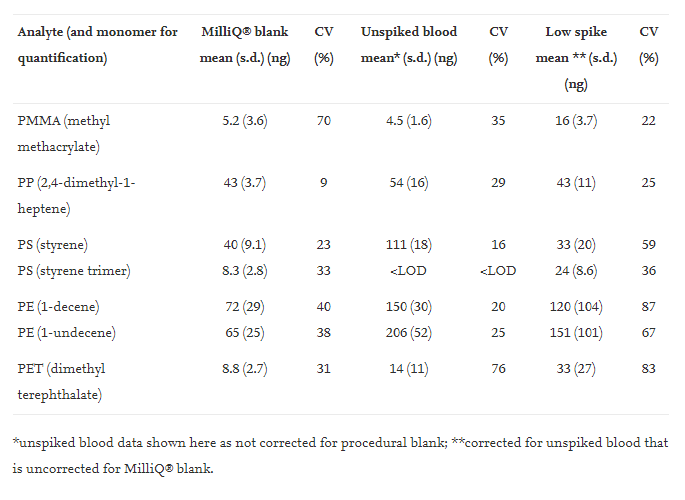
The background contamination in the eight MilliQ® blanks in the recovery experiment are given in Table 1. The blood used for the recovery experiment contained very low but still slightly elevated levels of PE and PS compared to the blanks; no other analytes appeared to be present in the unspiked blood (Table 1).
Table 1. Amounts of polymers (ng absolute) for procedural blank with MilliQ® analytical grade water, for unspiked blood and for low-spiked blood. s.d. standard deviation; CV, coefficient of variation; LOD, limit of detection.
Recoveries for the high spike experiment ranged from 68% to 114%, with low coefficients of variation, CV, (between 8% and 17%) (Table 2), indicating an adequate performance of the method at this concentration level. When PS was quantified with either styrene or the styrene trimer, the recoveries were 79% and 68% respectively. Similarly, for PE the recoveries were similar whether 1-decene (108% recovery) or 1-undecene (114% recovery) was used for quantification (Table 2). The recoveries are acceptable for this concentration range, which roughly corresponds to the range of concentrations quantified in actual blood samples from the donors. This part of the work demonstrated that the method could extract, identify and quantify low ppm concentrations of major polymers applied in contemporary plastics (Table 3).
Table 2. Analyte recoveries from a) high spike and b) low spike blood samples, mean recovery corrected for analyte concentrations in unspiked blood, standard deviation of the mean (s.d.), coefficient of variation (CV).
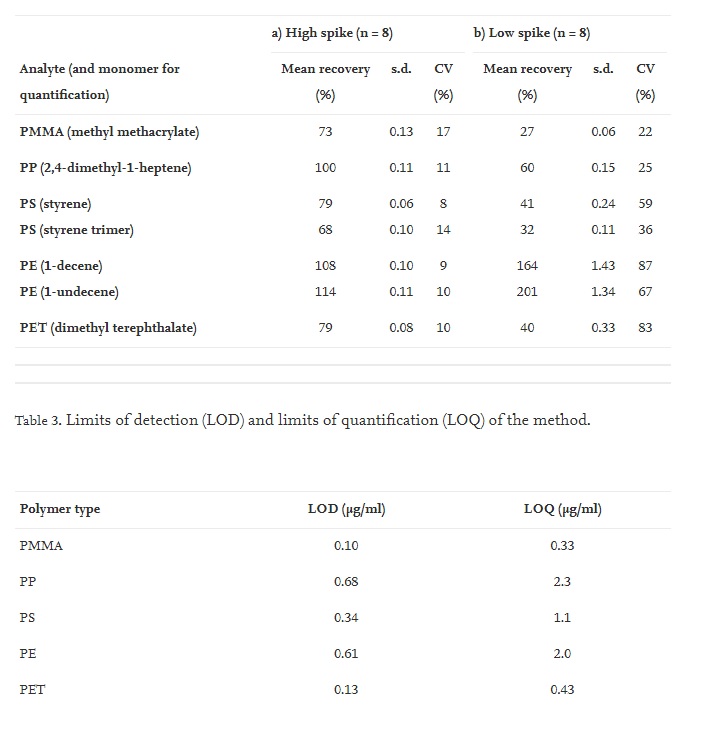
The low spike experiment recoveries were lower, with recoveries under 50% for most analytes except PP and PE (Table 2). This could be expected because the low spike samples were close to the LOQ. The recovery experiments showed that the method performed well in terms of recoveries of spiked analytes and CV (%) of the analysis of eight replicates in the quantifiable analyte concentration range of the samples.
3.1.2. Controlling for background contamination during blood sampling
It is essential to control for background plastic contamination throughout sampling and analysis of plastic particles. No background contamination of any of the target analytes could be detected from the glass BD vacutainers (all values
3.1.3. Controlling for background contamination during sample pretreatment and analysis
During the method development and validation stage of the study, we performed a large number of procedural blank analyses to ensure we could achieve low limits of detection of the method through sampling pretreatment to analysis. The data for procedural blanks (n = 31) performed during the measurement of the blood sample series were sufficiently low for this: the average ng absolute (on column) and coefficients of variance (CV) were 7.1 ng PMMA (CV 86%); 75 ng PP (CV 61%); 36 ng PS (CV 63%); 95 ng PE (CV 43%); 12.5 ng PET (CV 72%). All blank data fell within ±2σ control limits, with the exception of one outlier for PMMA and 2 outliers for PET (i.e. 1.6% of 186 measured blank data points). The large number of blank analyses built the evidence that the values measured in real samples are not false positives.
Background contamination during sample preparation and analysis measured via blanks (n = 31) were sufficiently low to enable detection and quantification of four polymers. The measured concentration data in blood were corrected for the average procedural blank for each analyte.
3.1.4. Limits of detection and quantification
The LOD and LOQ for each analyte are given in Table 3.
Values between LOD and LOQ are displayed in the supplementary information (Table S2) with an asterisk, though they cannot be reliably quantified because of the difficulty of calibration near detection limits. Such values can be regarded as being above the lowest concentration of each polymer that can be detected though without guarantee of precision. Values under the LOD after blank correction are reported as less than the value of the LOD for that sample (Table S2).
3.1.5. Duplicate measurements of donor blood
In the 18 donors for which duplicate analyses were performed, it was rare for duplicates samples to show both a non-detect (value
This is the first study of its kind to use Py-GC/MS for plastic particle analysis of whole human blood, a highly complex matrix, and we expect the sensitivity of the next generation of this method to improve, as with all new methodologies.
3.2. Measured concentrations in blood
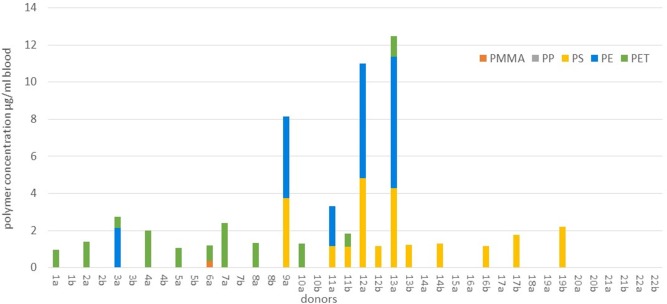
Data for concentrations in blood were generated for PMMA, PP, PS, PE and PET, demonstrating that 77% of donors (n = 17 out of 22) carried a quantifiable (>LOQ) mass of plastic particles in their blood (Fig. 1 and Table S2). The patterns of polymer types and concentrations varied per sample. PET was the most widely encountered (>LOQ values in 50% of all tested donors), followed by PS (36%), PE (23%) and PMMA (5%). No PP > LOQ could be measured in any donor. The three polymers most frequently measured > LOQ were also present at the highest concentrations. The maximum concentration of PET analysed in a blood sample was 2.4 µg/ml, for PS this was 4.8 µg/ml, for PE this was 7.1 µg/ml. Up to three different polymer types in a single sample were measured (Fig. 1). To make a conservative estimate of the quantifiable sum polymer concentrations in the blood of donors in this study, we summed all analyte values >LOQ per sample and took the mean of the duplicate measurements per donor. Where values were
The duplicate measurements of blood aliquots from the same donor show better agreement when values between LOD and LOQ are observed along with >LOQ values (Table S2) rather than solely the values >LOQ (Fig. 1). Reasons for this include the high percentage of data between LOD and LOQ compared to the data >LOQ. We also considered the possibility of patchy distribution of the particles in the whole blood matrix. When determining the concentrations in an individual donor it may be important to make use of replicate measurements, considering the possible patchiness of the analytes and the challenges of acquiring a single representative sample for analysis. As method sensitivity improves in next generation analyses, lower LOQs may significantly enhance duplicate measurements in this concentration range.
While this study provides evidence that plastic particles are present in the human bloodstream, we found a high frequency of non-detects, and the percentage of donors for which values >LOQ were measured varied per polymer type. No values >LOQ were measured for PP in any donor, and only one donor tested >LOQ for PMMA. For the three most detected polymers, the number of donors with values >LOQ were 5 for PE (23% of all donors), 8 for PS (36%) and 11 for PET (50%) (Table S2). The frequency of non-detects measured also varied per polymer type. The percentage of all donors for whom the analyte was consistently
The relatively high frequency of non-detects and the lower frequency of >LOQ values led to the decision to present the data in Table S2 showing all values >LOQ,
The particle size range targeted in this study was between 700 and 500,000 nm due to the filtration step prior to analysis and the inner diameter of the needles used for the blood draw. Because of the individual polymer concentrations detected (not exceeding 7.1 µg/ml), particles in the blood samples were likely in the low- or submicron range. A sample with e.g. a polymer concentration of 1.6 µg/ml could hypothetically be achieved by the presence of a single spherical plastic particle with diameter of around 125–150 µm, or multiple smaller particles. However, such large particles are less likely to be present in real blood samples due to their lower bioavailability for uptake. With thermal desorption techniques such as Py-GC/MS, we can report the particle masses in blood per polymer type, though not the number of particles. Human exposure studies of air particulates also report particulates in µg/m3 air, and not in particle numbers. The Py-GC/MS technique is suited to cases where the mass concentrations of contaminants are needed, e.g. mass balance modeling, pharmacokinetics studies and comparisons among individuals in a population.
3.3. Plastic’s biological fate?
The fate of plastic particles in the bloodstream needs further study to answer questions regarding the potential accumulation in the general population and occupationally exposed workers, the environmental factors contributing to the internal exposure and toxicological and human health effects that may result from different exposure scenarios (Wright and Kelly, 2017, Leslie and Depledge, 2020, Vethaak and Legler, 2021). It is scientifically plausible that plastic particles may be transported to organs via the bloodstream. The human placenta has been shown to be permeable to 50, 80 and 240 nm polystyrene beads (Wick et al., 2010) and likely also to microsized polypropylene (Ragusa et al., 2021). In a study of acute lung exposure to nanopolystyrene spheres (20 nm) in rats, the translocation of plastic particles to placental and fetal tissues was demonstrated (Fournier et al., 2020). Bioaccumulation of small polystyrene micro-particles in the liver, kidney and gut was observed after oral administration in mice in vivo (Deng et al., 2017, Lu et al., 2018).
Further supporting evidence for the translocation of plastic particles comes from drug delivery sciences, where polymeric carriers of pharmaceuticals have been dosed in mammalian test systems (Yee et al., 2021). The polymeric nanosized carriers are able to deliver drugs across the blood brain barrier (Han et al., 2018). The typical residence time of plastic particle in the bloodstream is at present unknown, as is the fate of these particles in the human body. From polymeric nanocarrier research, we expect the residence time to vary with particle chemistries, surface charges, shapes and sizes (Bertrand and Leroux, 2012, Rabanel et al., 2012, Rabanel et al., 2019, Fullstone et al., 2015). In preclinical experiments in drug delivery it is known that a phenomenon termed accelerated blood clearance (Dams et al., 2000) acts to reduce residence time upon repeated (chronic) exposure to polymeric nanoparticles in the bloodstream.
The uptake routes of plastic particles detected in human bloodstream are likely to be via mucosal contact (either ingestion or inhalation). Dermal uptake of fine particles is unlikely except if the skin is damaged (Schneider et al., 2009). Airborne particles between 1 nm and 20 µm are considered respirable. Ultrafine (<0.1 µm) inhaled particles may become absorbed and accumulate in the lung, while most larger particles are expected to be coughed up and eventually swallowed, and have a second chance of absorption via the gut epithelium (Wright and Kelly, 2017).
The plastic particle concentrations reported here are the sum of all potential exposure routes: sources in the living environment entering air, water and food, but also personal care products that might be ingested (e.g. PE in toothpaste, PET in lip gloss), dental polymers, fragments of polymeric implants, polymeric drug delivery nanoparticles (e.g. PMMA, PS), tattoo ink residues (e.g. acrylonitrile butadiene styrene particles).
4. Conclusion
The quality-controlled measurements of plastic particles as mass concentrations using Py- GC/MS in blood demonstrated in this study provide a unique dataset that supports the hypothesis that human exposure to plastic particles results in absorption of particles into the bloodstream. This indicates that at least some of the plastic particles humans come in contact with can be bioavailable and that the rate of elimination via e.g. the biliary tract, kidney or transfer to and deposition in organs is slower than the rate of absorption into the blood. HRA requires measured internal exposure data, and these must be empirically collected. Without such measured exposure data, no absorption models can be validated and no statements about risk or no risk can be made (Leslie and Depledge, 2020, Vethaak and Legler, 2021). It remains to be determined whether plastic particles are present in the plasma or are carried by specific cell types (and to which extent such cells may be involved in translocating plastic particles across mucosa to the bloodstream). If plastic particles present in the bloodstream are indeed being carried by immune cells, the question also arises, can such exposures potentially affect immune regulation or the predisposition to diseases with an immunological base?